 Kosken
Product
Monitors you choose
A monitor is a check that you define for one or more machines. When it fails a number of times in a row, it opens an incident, and the incident response starts.
Free for up to 5 machines. Every machine starts in audit mode: Kosken reads and reports, and changes nothing.
What a monitor can watch
- Services and ports
A systemd service, a TCP port, failed systemd units, or a URL with the status that you expect.
- Resources
Disk, CPU, memory and load, with the limits that you set.
- Logs, certificates and commands
A pattern in a log, the expiry of a certificate, or a read-only command.
- Containers
A container monitor checks that a container is up, running, or healthy, or that it did not restart more than a number of times in a time window. The form suggests container names from the inventory of the machine.
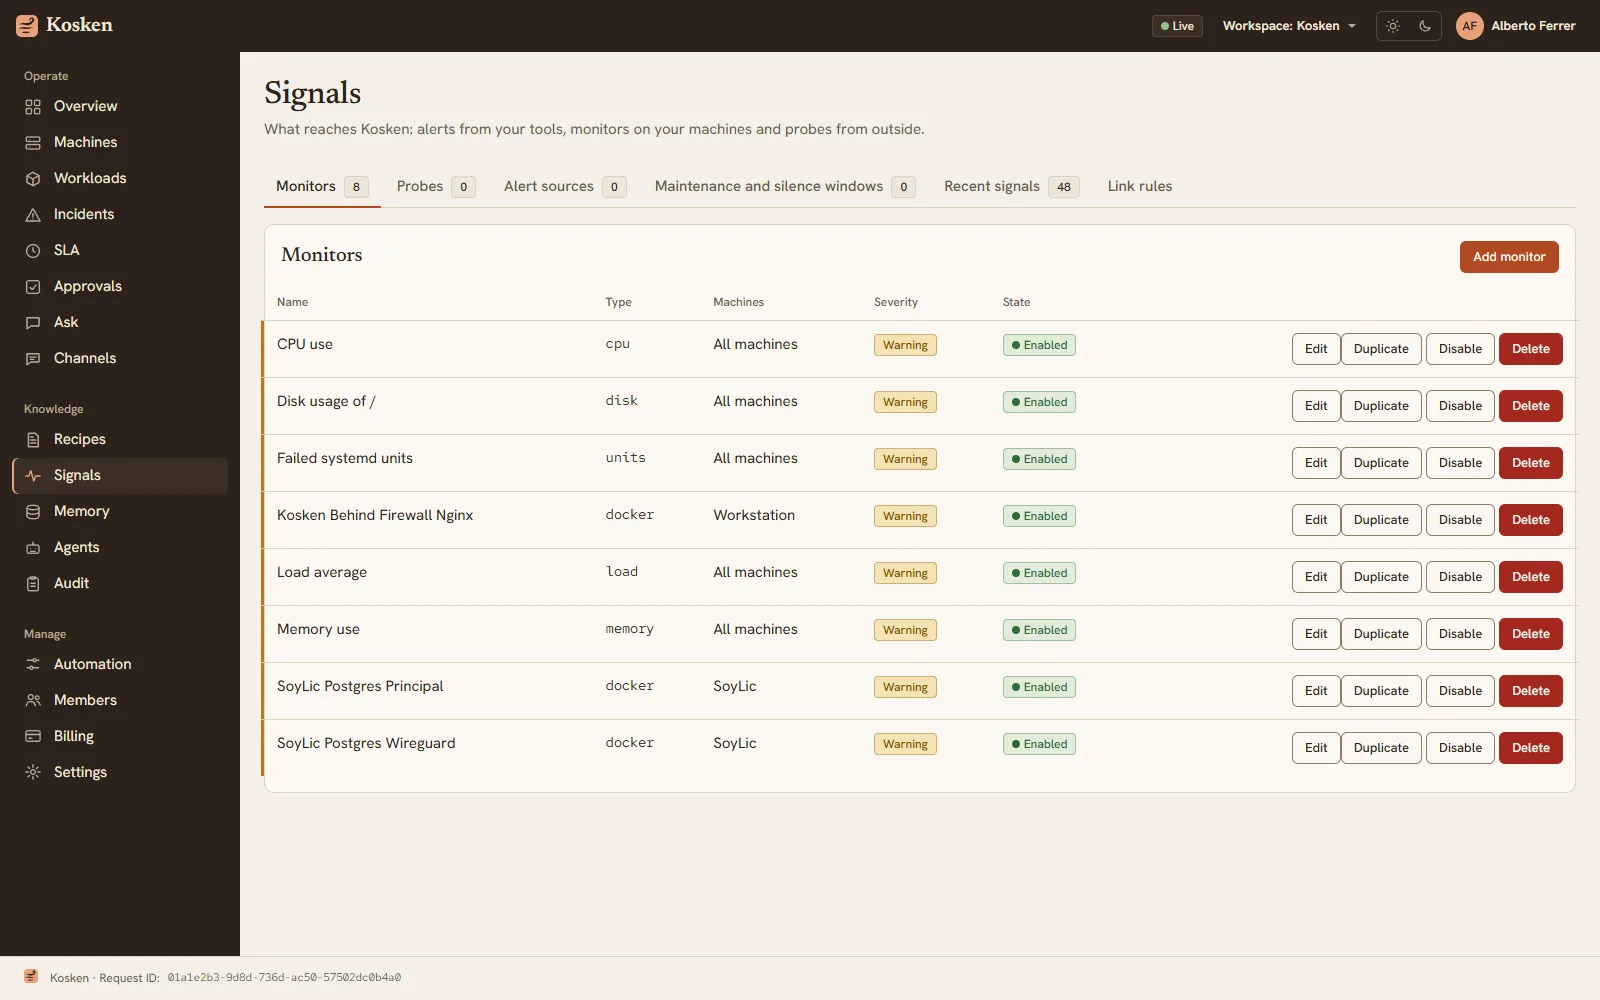
From a monitor to an incident
- In a row, not once
A monitor opens an incident only after it fails the number of times in a row that you set. One bad reading does not wake anyone.
- Silence during maintenance
During a maintenance window, the signals of its machines are silenced. See Tasks and maintenance.
- Workloads
The Workloads page lists the containers, Proxmox virtual machines and LXC containers, and Kubernetes pods of each machine, with one tab for each machine.
More of Kosken
- Incident responseFrom a failed signal to a root cause report and a checked fix.
- Recipes and approvalsSigned fixes, five gates in code, and a person who decides.
- Tasks and maintenanceScheduled checks, planned changes, and the jobs of each machine.
- Fleet and modesMachines, workloads, and the audit, shadow and live modes.
- Ask KoskenAsk about your fleet in plain words, with your own models.